This past weekend I got to put the Digital Dashboard to the test. I went to a two-day track event at Palmer Motorsports Park in Palmer, MA with COMSCC. This was my first event with COM, but they turned out to be a great group and I really liked the Time Trials format they run.
For the seven session out on track, the dashboard worked really well. I’ll elaborate:
Display:
The shift light was bright even in sunlight. I did have to rely on the low end of my peripheral vision to see it though. I mostly was able to discern the color, particularly when i got into the orange and red section of the LED strip. Currently, the left half always lights or yellow, the next quarter is orange, and the final quarter is red. I think i’m going to change it so that the entire strip changes colors as the graphs advances instead of just the region of the graph. So at first it will be yellow, as it passes halfway the entire thing will turn orange, and as it advances past 3/4 the entire thing will be red. That should make it easier to catch the color and thus general RPM out of the corner of my eye.
The LCD was also contrasty enough to read in direct sunlight. I was surprised at how often i glanced at the gear indicator. The large block number was easy to read. I didn’t try to read the small sensor values while driving, but i did glance at the bar graphs. Just like an analog gauge, you get a feel for the normal centered position and basically just look for any extremes.
I have a separate display page for real time accelerometer info, but i never bothered with it while driving. I did however, review the peak G-Force numbers after a few sessions out of curiosity. I now plan to make another display page with min and max values for all sensors that I can review after a session. That’s a lot easier than digging through the log files on a computer.
GPS:
The PA6H based GPS module with external antenna did a great job.
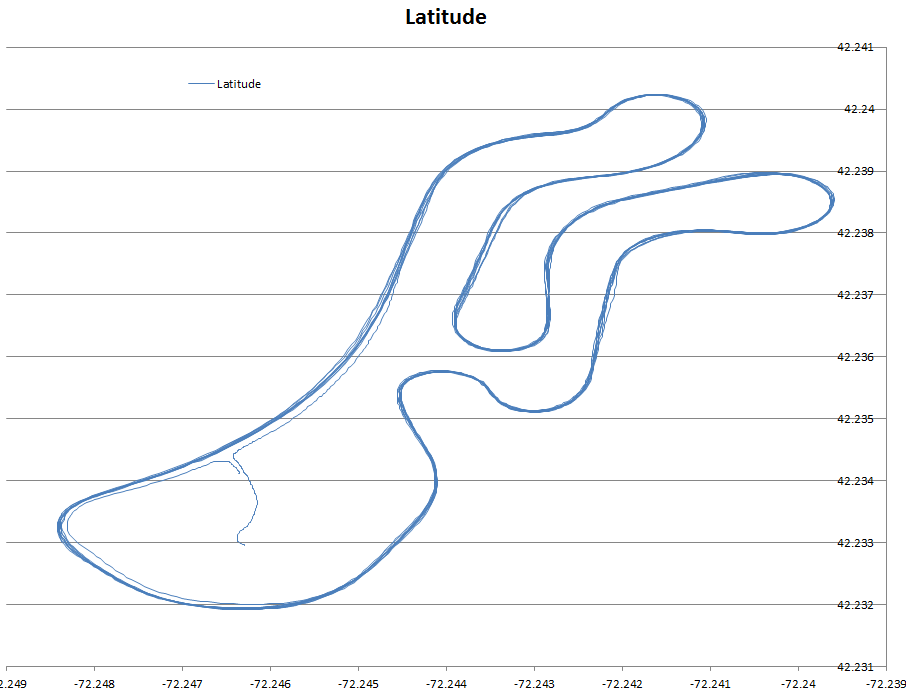
It’s running a 5hz l ocation update rate with SBAS completely unfiltered. I’m pumped to see how clean it looks with no filtering. You can easily distinguish the pit out and pit in lines as well as a pass between T5 and T6 during this session. You can also see on the the variation along the curved front straight which is my trying to run close to a concrete wall, but being a little nervous about it.
Now that I know the data is fairly clean, i’m going to implement some lap timing features.
Sensors:
Whole point of this thing is to collect accurate data. I’d say it was pretty successful. This is oil and water temp over the course of a session:
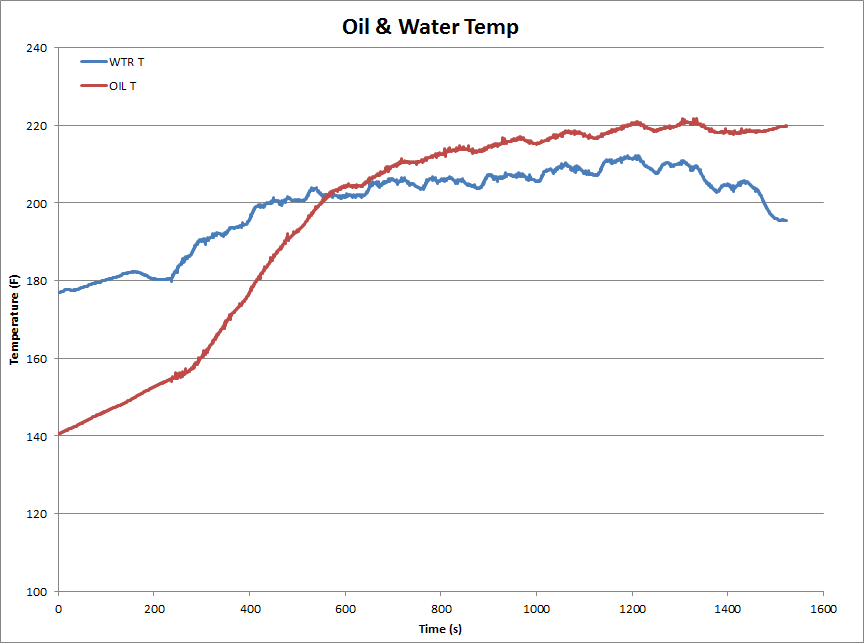
I also logged Oil Pressure and was happy to see no oil starvation indicating drop outs. It’s logging at 10hz so that should be able to catch it I think.
X-Y acceleration data looks pretty good, if not a little noisy. I have a low pass digital filter on the data but i may need to lower the cut off frequency a bit since I’m after the general force on the car while turning/braking, not high frequencies bumps/vibrations, etc.
Logging:
The logged data seems to have worked well. I can’t find any skipped samples or anything. The only issue i had was more of a usability one. I have button on the dashboard to start and stop recording. If i forgot to hit the stop button before i power off the dashboard/logger, it won’t close the file and it won’t be saved. I lost a few sessions to this.
I need to come up with a way either to incrementally save the log file or have some sort of shutdown sequence. Or maybe just a big note on the dash.
All in all, I’m really happy with how it worked out. I was able to load all the data into RaceRender 3 and generate a rather informative track video!